July 12, 2010

Combating IE6: jQuery Png Fix

For all you web designers out there: We've all come a long way together.. plodding through all the horrific browser incompatibilities. Telling each other different hacks and tricks. ...trying to avoid those horrific box model differences. We're all optimistic about standards in the future.. but how are we still dealing with archival browsers? Some people say "screw IE6 who gives a crap?" But people like me who make sites for older clients and organizations that still might have IE6 running on their internal systems just cant turn our heads. Well, here is my "Combating IE6" tip #1:

jQuery PNG Fix

Well, jQuery has been around for a while now.. and I absolutely love it. I've been using a jQuery .png fix script for a while now and I thought I'd share. As they say:

This plugin will fix the missing PNG-Transparency in Windows Internet Explorer 5.5 & 6.

You will go from this to this: (yay!)

png brokenpng fixed http://jquery.andreaseberhard.de/pngFix/ is the link to the script.

All you do it install it, and the latest jQuery.. point to it in your header.

[code]
<pre><code><head>
...
<script type="text/javascript" src="jquery-latest.pack.js"></script>
<script type="text/javascript" src="jquery.pngFix.js"></script>
...
</head>
[/code]

then document-ready function it:

[code]
<pre><code><head>
...
<script type="text/javascript">
$(document).ready(function(){
$(document).pngFix();
});
</script>
...
</head>
[/code]

and YATTA! PNG's are magically fixed!

download here: http://jquery.andreaseberhard.de/pngFix/

More combating IE6 posts to come. Would love to know your methods!
July 1, 2010

Good Web Type Article: “Cross-browser kerning-pairs & ligatures”

Thanks to my friend Noël, I have come across this great article on web type kerning and ligatures.

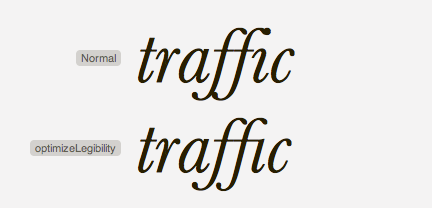
Cross-browser kerning-pairs & ligaturesImproved handling of kerning pairs and ligatures in modern browsers using the "text-rendering: optimizeLegibility;" declaration.

I never knew about this declaration - an interesting read and I can see some typekit experiments in my future.

June 17, 2010

WordPress TV: Mitcho Erlewine: Abstract Your Code

This is the video from my favorite session from WordCamp San Francisco. Mitcho Erlewine did a wonderful talk on abstracting code that really challenged me to produce better, cleaner, reusable code. Here is the video description:

Mitcho Erlewine discusses avoiding programming disasters by properly abstracting the code you write and how you can make sure to write code both you and others can reuse in the future.

Read my WordCamp San Francisco recap post

- sara cannon

June 11, 2010

The Art of Open Source: Using Flickr Geotags to Map the World’s Cities

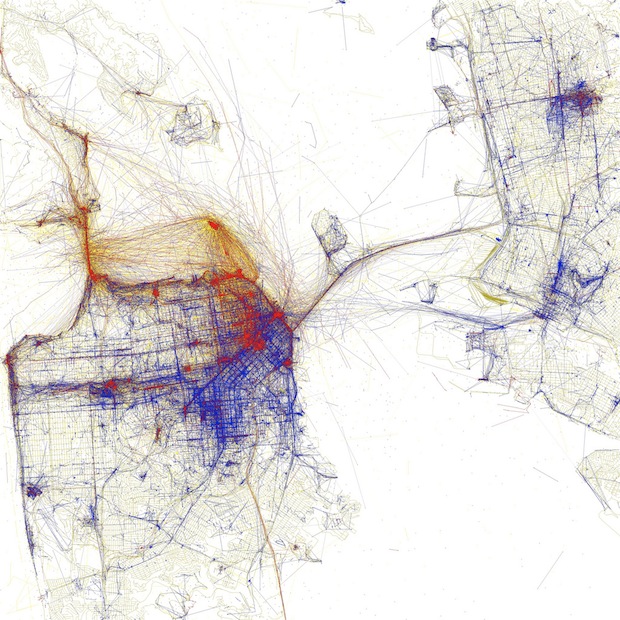
Fast Company has a wonderful article about how photographer Eric Fischer uses Flickr geotags to map world cities. Using Flickr's public API he's created over 50 elegant city maps. These are just facinating and beautiful! A great representation of community, humanity, and the art of open source.

Fast Company explains the color coding as:

Black is walking (less than 7mph), Red is bicycling or equivalent speed (less than 19mph), Blue is motor vehicles on normal roads (less than 43mph); Green is freeways or rapid transit.

Here is San Francisco:

 Using Flickr Geotags to Map the World's Cities - Eric Fischer - San Francisco

New York:

 Using Flickr Geotags to Map the World's Cities - Eric Fischer - New York

London:

 Using Flickr Geotags to Map the World's Cities - Eric Fischer - London

Eric also made a set based upon weather you are a tourist or a local. Here is what he had to say about it on his Flickr:

Blue points on the map are pictures taken by locals (people who have taken pictures in this city dated over a range of a month or more).

Red points are pictures taken by tourists (people who seem to be a local of a different city and who took pictures in this city for less than a month).

Here is New York Based upon Tourists or Locals:

 Using Flickr Geotags to Map the World's Cities - Eric Fischer

And San Francisco based upon Tourist or Local: (I love how Alcatraz and the Golden Gate, and the Pier are clearly defined as tourist)

 Using Flickr Geotags to Map the World's Cities - Eric Fischer

Check out the Fast Company article, Eric's Fischer's Local's and Tourist's Flickr Set,  and his Geotaggers' Word Atlas Flickr Set.

June 11, 2010

Design Inspiration: Cristiana Couceiro

Christiana Couceiro is a freelance illustrator, working and living in Lisbon, Portugal. Her collages are really inspiring... very mid-century. And I just love her art series on her website. Check it out!

Cristiana CouceiroCristiana CouceiroCristiana CouceiroCristiana CouceiroCristiana CouceiroCristiana CouceiroCristiana Couceiro

found via ISO50

June 1, 2010

New Site: IsItBeer30.com

So, I've created a new website for fun:
isitbeer30.com

When you go to it, it either tells you yes or no.. and if the answer is no, you can click "But I want it to be" and then it will be yes.

I think its funny... and I actually go there when I'm wondering.. "Is is beer 30?" Let me know what you think!

"It makes sense to me, does it to you?"

- sara cannon

May 31, 2010

REYKA Vodka Re-Design

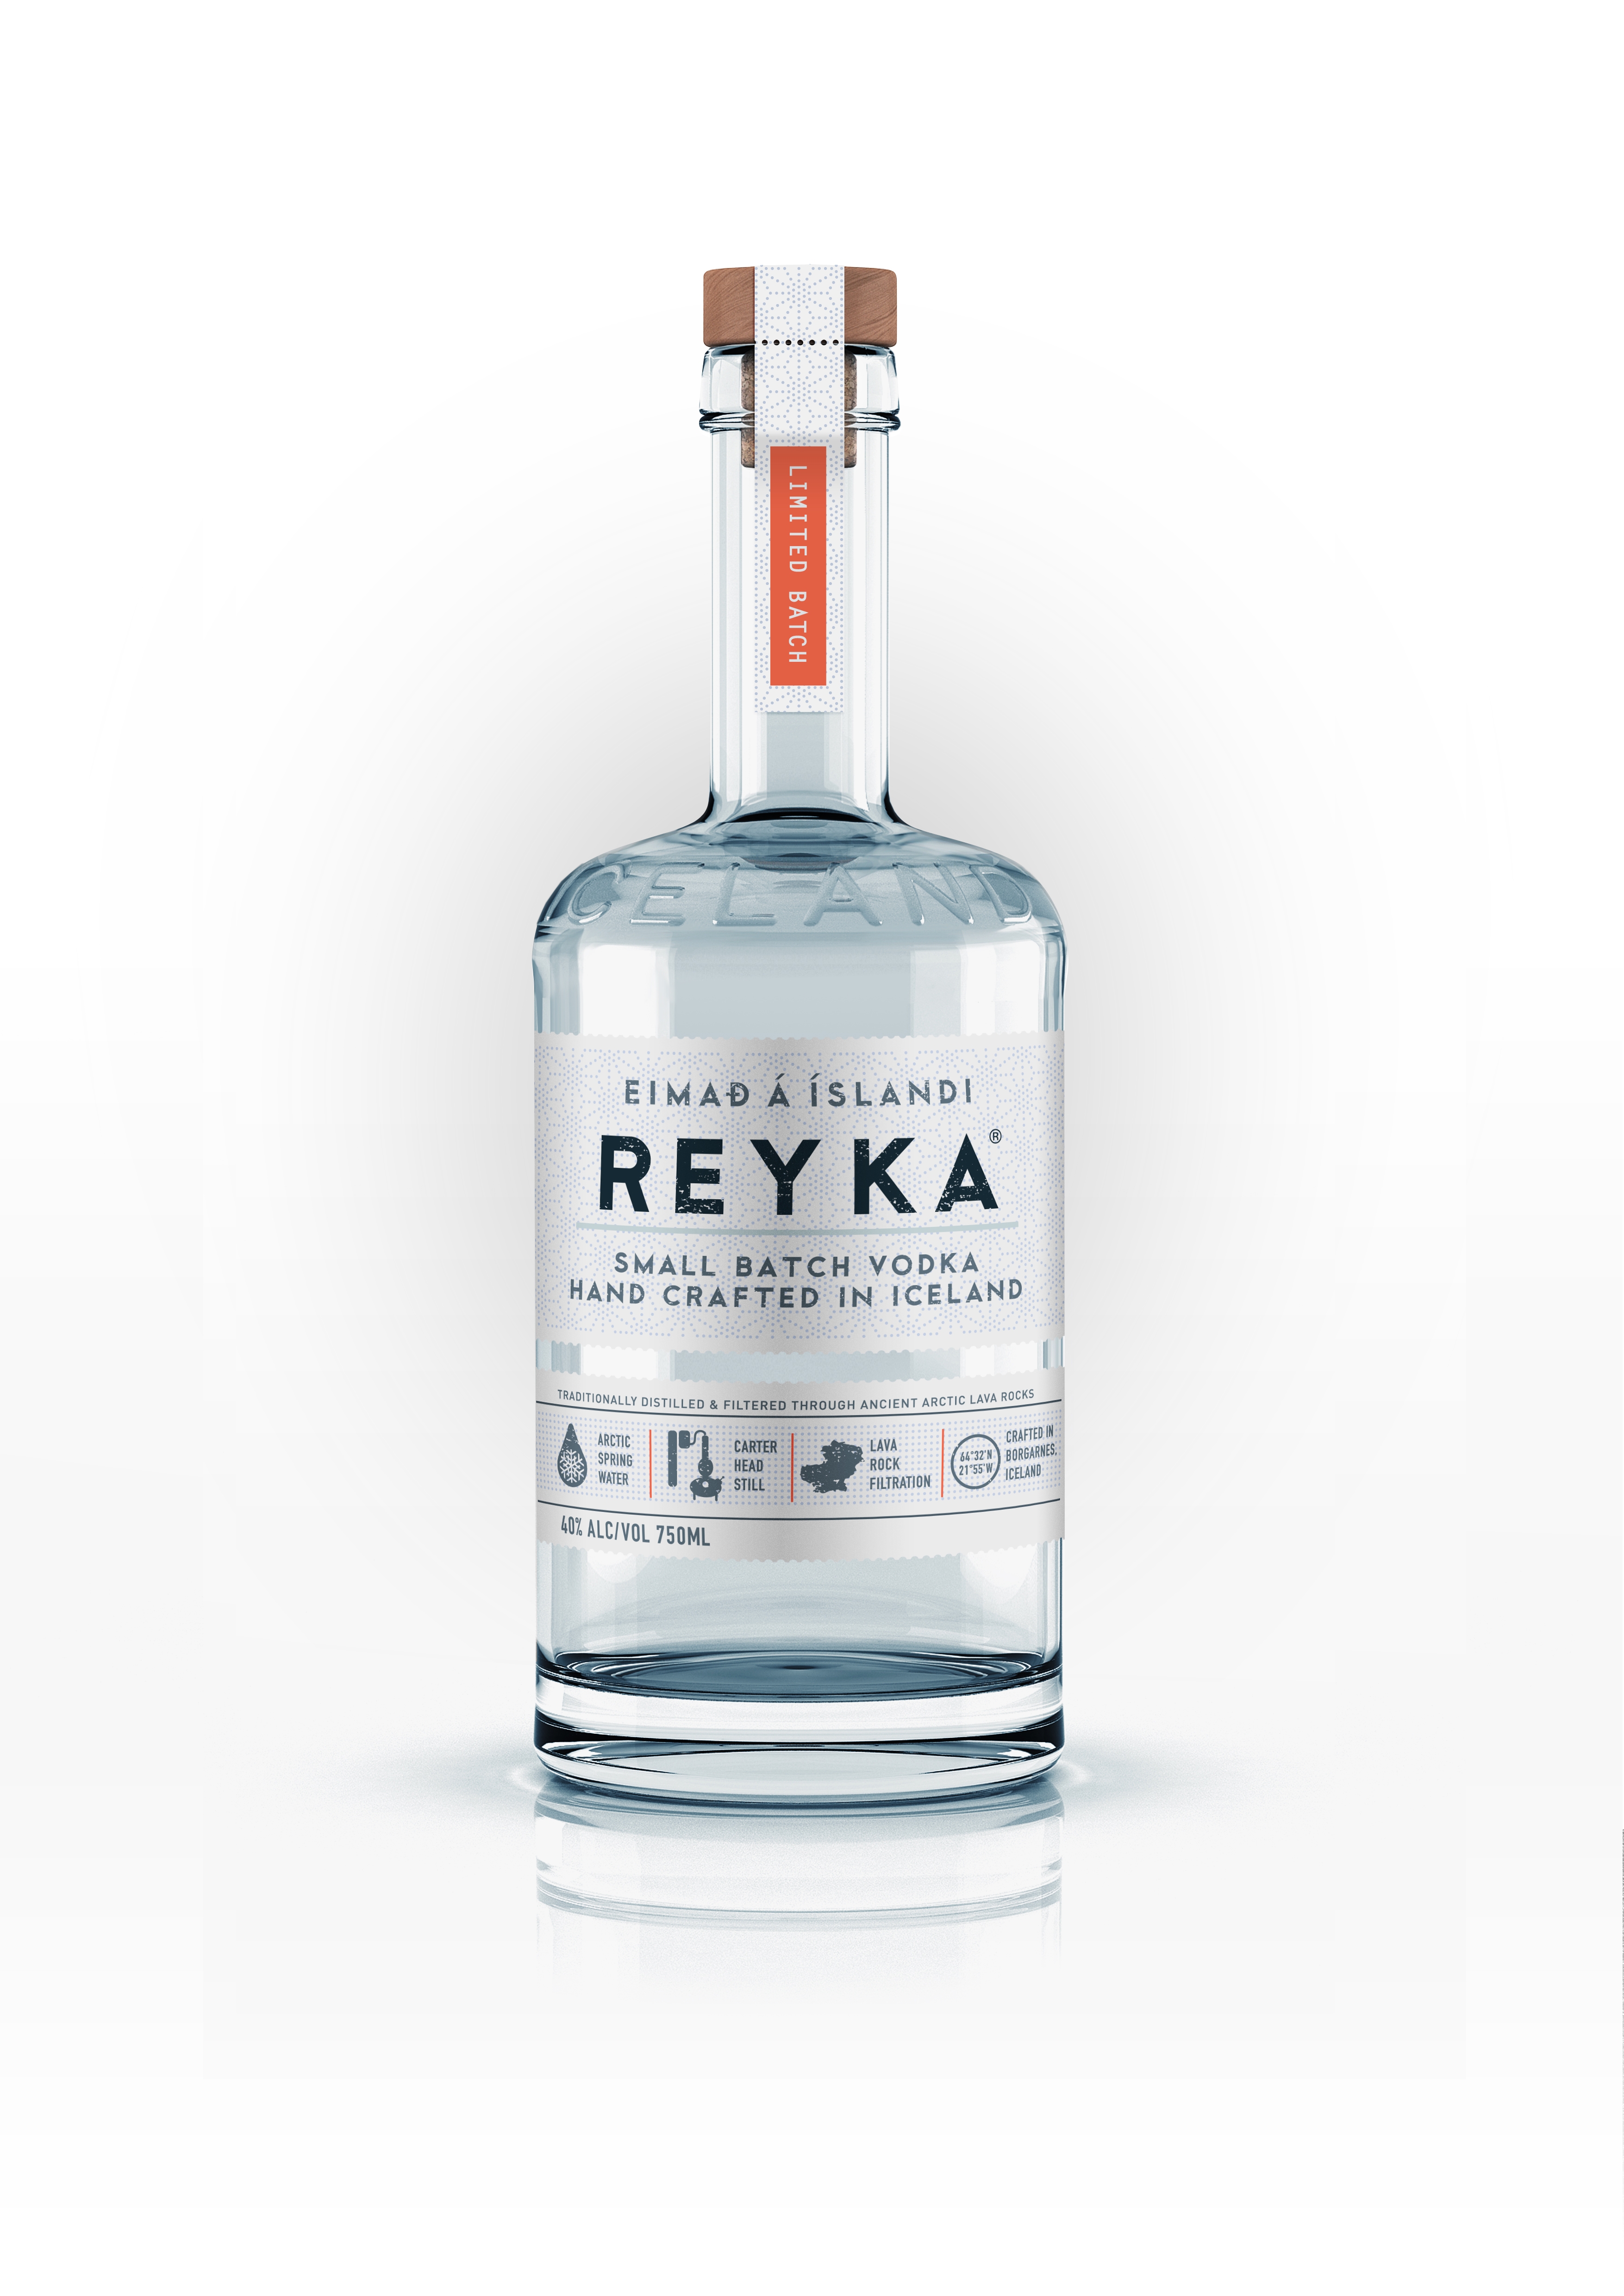
reyka vodka re-design

I just love REYKA Vodka's new re-design. The bottle looks so fresh and all details are beautifully flushed out.. from the icons at the bottom to the subtle geometric background pattern that embraces the scalloped label edge and perforation. The Islandic-esque blue/grey warmed by wooden cork and orange brings it all together. Their website doesn't do this bottle justice... all pixel-y and flash with a focus on cluttered degraded type. I just like the opening two frames - simple like the bottle.  - sara cannon

found via Colt+Rane

May 27, 2010

Inspiration: The Work of Natalie Nicklin

I'm really loving the style of Designer/Artist Natalie Nicklin.Natalie Nicklin - Another WorldNatalie Nicklin - Font Experiment

Found Via The Post Family

May 21, 2010

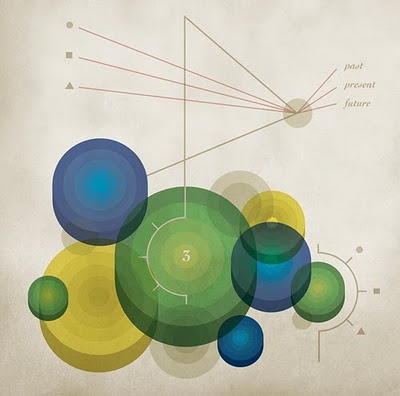
Nonsensical Infographics by Chad Hagen

I mentioned earlier that I love visual information. So, what could be better than some nonsensical infographics by Chad Hagen!

Nonsensical Infographics by Chad HagenNonsensical Infographics by Chad Hagenfound via mstetson design

May 19, 2010

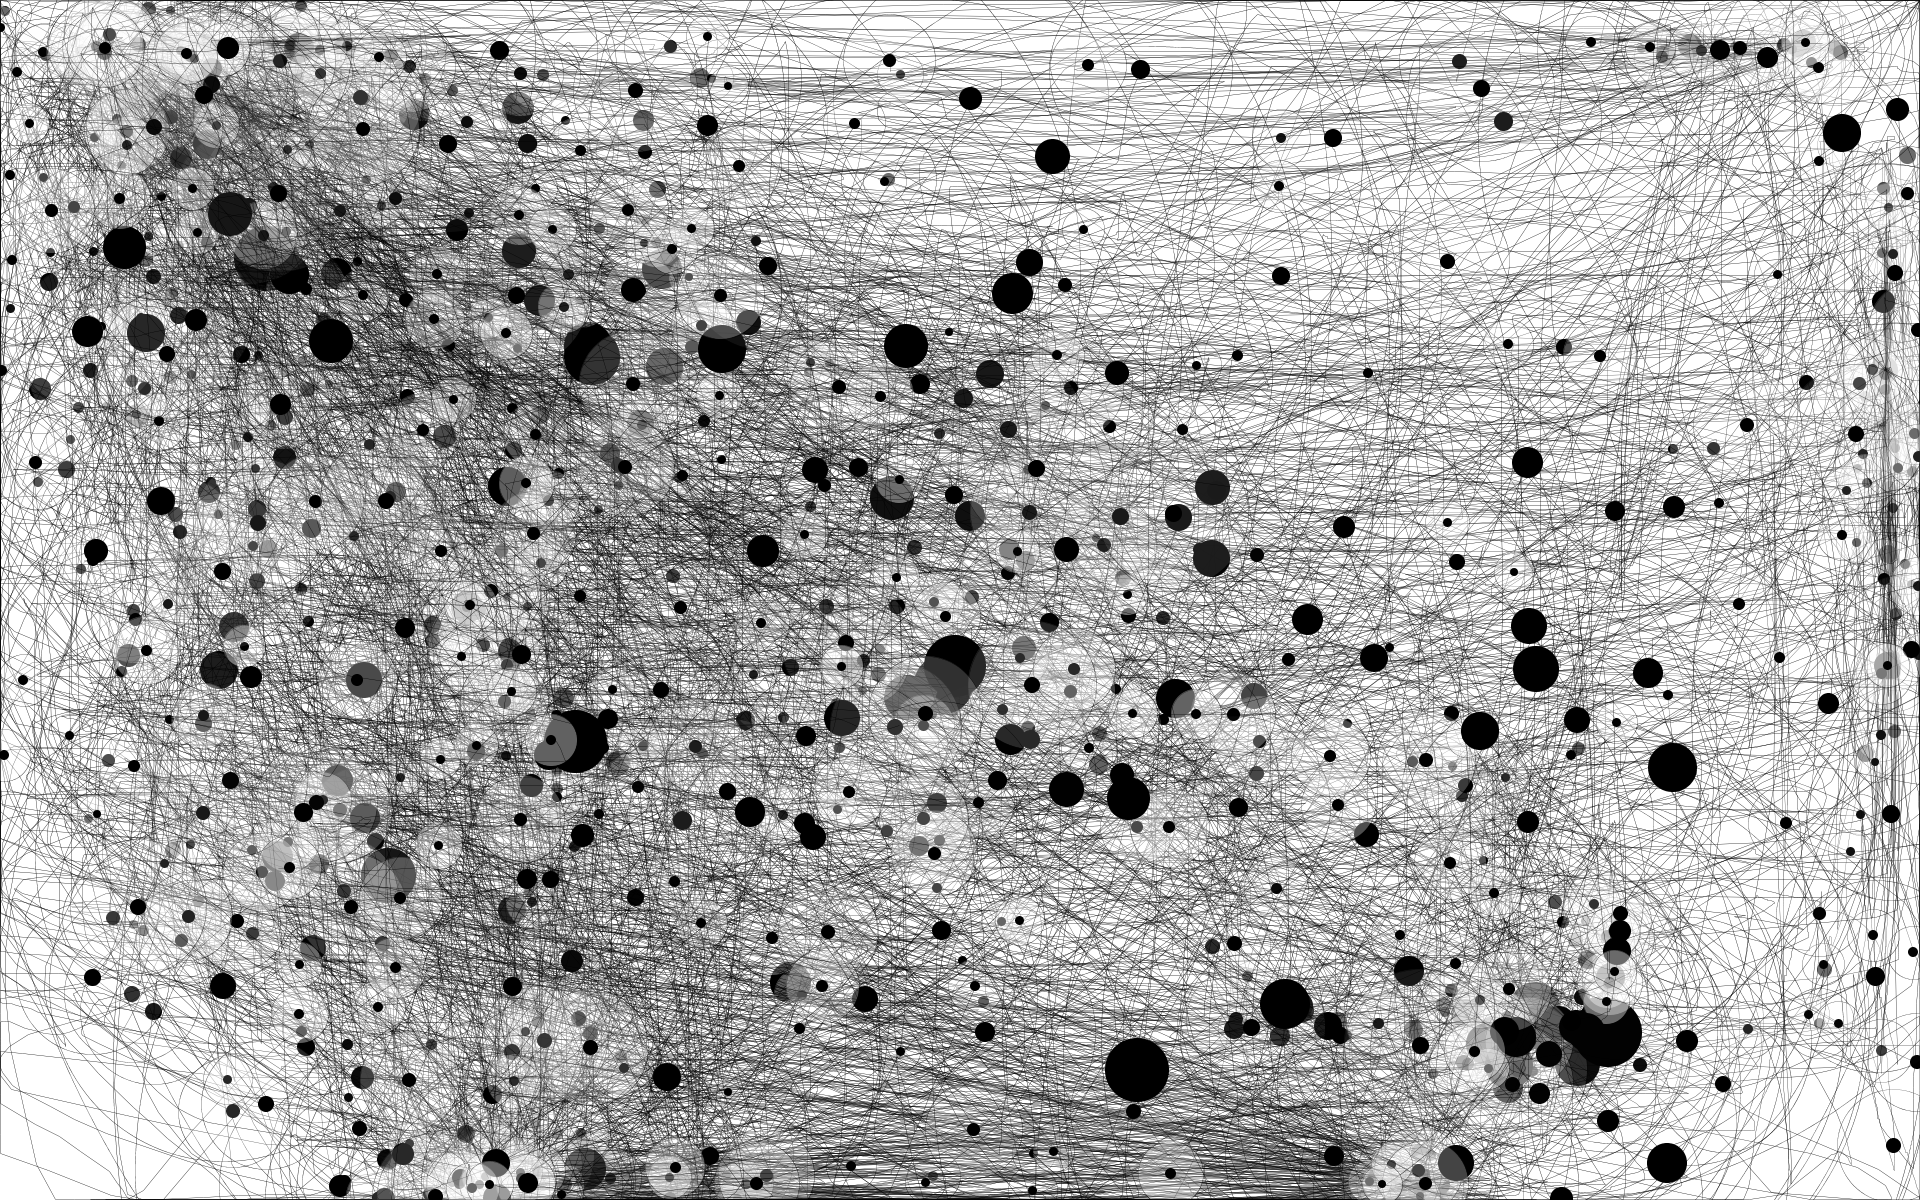
Mouse Movement Experiment

I decided one day that I would track my mouse movement workflow for 2 days with the program IOGraph.  Here are the results. The large spots are when I left my computer for lunch or something like that. I don't think this will mean anything to you but I'm obsessed with visual data so here's the experiment:

Day 1:

Day 2:

After two work days I decided to stop. You can check the titles of the images if you want an accurate time stamp. (I really dont know why you would.)

-Sara Cannon

Sara Cannon is a Web Design and Branding Specialist | Helping brands build seamless digital experiences.
She's also an Artist.


Do you have a project she can help you with? Contact Sara at sara@saracannon.com.

Skip to content